A key to gaining funding is making numbers visible through easily readable financial slides in your pitch deck. Investors are like Rod Tidwell in “Jerry Maguire” ~ they want you to SHOW THEM THE MONEY ~ literally. Here’s a few key financial forecasting charts and graphs to include in your pitch deck that make your strategy visible to investors:
1. Income vs Expenses
This is your big chance to show that hockeystick to success. Sure, you might bump along at little or no profit for a year or so. You might even go for a loss early on. But every investor gets that. They just want to see how they make their money back and more. Like 10X more. This means showing accurate numbers on both the income and expense sides that add up to a great bottom line that scales up over time.
2. Burn Rate
Burn rate is all about understanding the amount of resources you need on a monthly basis. Many businesses have heavy sales seasons which means heavy burn rates for things like labor and supplies. Purchasing inventory in advance of heavy sales seasons is also a key burn rate issue. You don’t ever want to get caught short of key resources, particularly when you have more significant sales opportunities, so be prepared by doing the numbers.
3. Cash Flow
The secret to a healthy business is balancing the amount of cash flowing in and out of your business. Too much cash not working for you means less than peak performance. Not enough cash means you could be on the edge of a red line failure. Optimizing your monthly cash reserves helps you grow your business quickly and safely.
4. Income Breakdown
Every business starts off with a business model, but not every business gets it right the first time around. That’s what the “Lean Startup “ method and “pivots” are about. Interestingly, most businesses find that they make most of their money in a minority of their offerings. Thus, this graphic offers great rationality, vision and buy in.
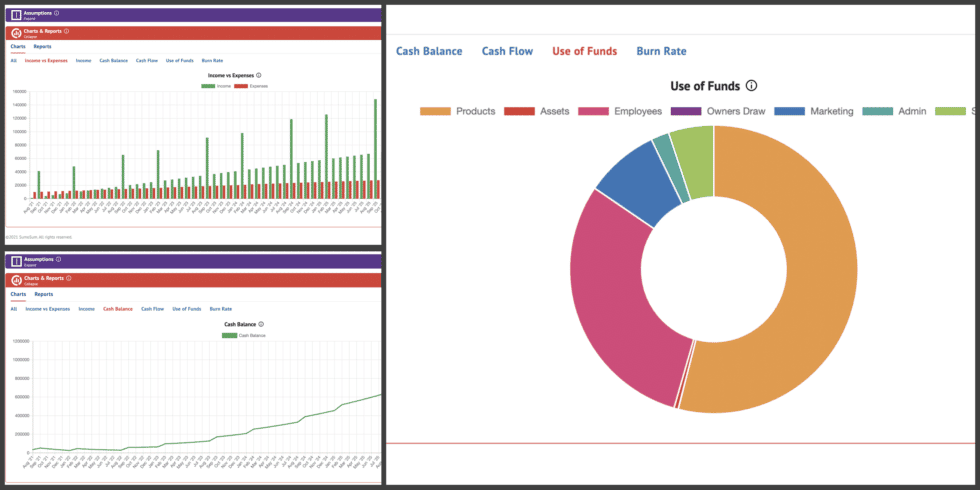
5. Use of Funds
Every investor wants to know how you’re going to spend their money. Thus, expense strategy is a key to funding success. And to keep the discussion high-level, a Use of Funds pie chart avoids presentations digressing into the minutia of spending detail.
How to Create Financial Slides for Your Pitch Deck
Financial forecast charts and graphs are generally made via spreadsheets, which entails defining expense categories, creating formulas, programming macros, formatting charts and graphs and exporting graphic files. You have to be part CPA, computer programmer and graphic designer to pull all that off. Short-cut the process with SumoSum, our super-simple financial forecasting software.
It’s free, no credit card required and no strings attached. Sign Up, FREE! »